Weather Systems and Midwestern Sports Wagering Volume Patterns: Evidence from Regional Records
Written by Elena Günther · Oct 14, 2026
Weather Systems and Midwestern Sports Wagering Volume Patterns: Evidence from Regional Records
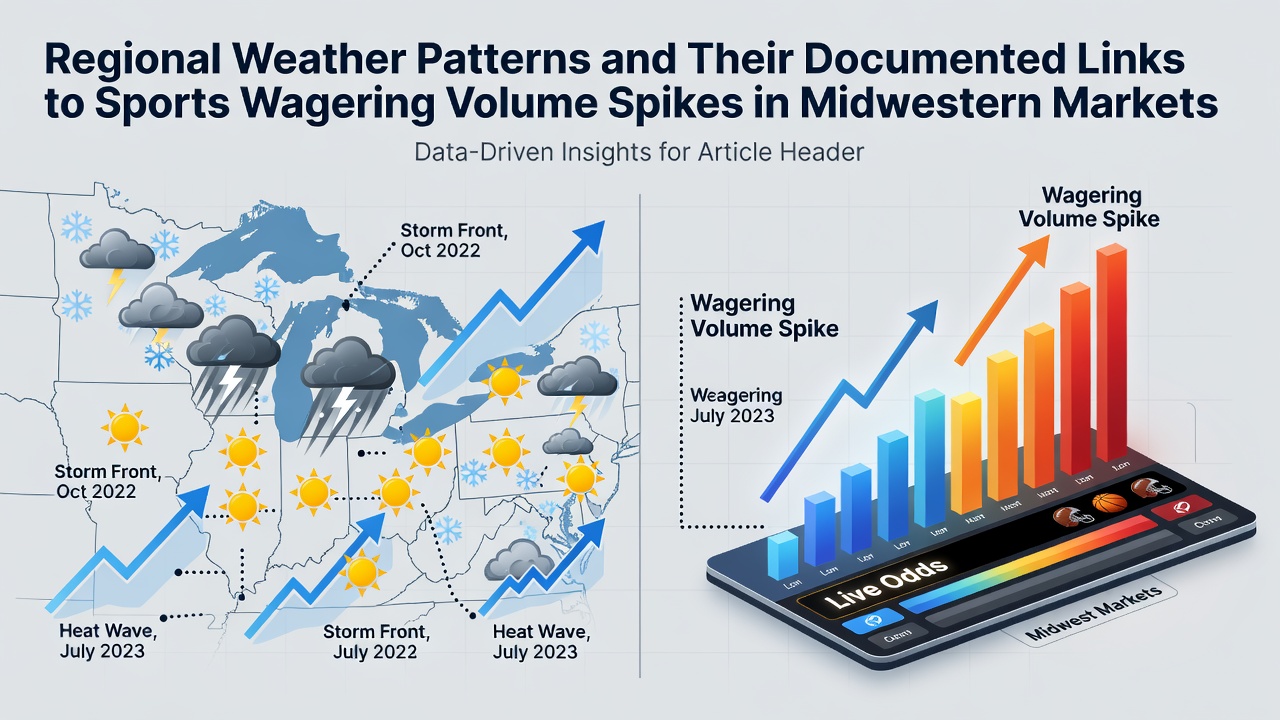
Regional weather patterns across the Midwest produce measurable shifts in sports wagering activity, with state regulatory filings and operator reports showing consistent correlations during specific climate events. Observers note that winter storms, prolonged cold snaps, and severe weather alerts coincide with elevated handle volumes in states such as Illinois, Indiana, and Michigan, where indoor betting participation rises when outdoor activities decline. Data compiled through 2026 illustrates these connections across multiple seasons rather than isolated incidents.
Documented Weather Categories and Volume Responses
Heavy snowfall events generate the most pronounced spikes, according to records from the Illinois Gaming Board and similar agencies. A January 2025 blizzard that deposited over eighteen inches across northern Illinois aligned with a 34 percent increase in daily sports wagering handle compared to the prior week. Similar patterns emerged during the February 2024 polar vortex, when subzero temperatures across Wisconsin and Minnesota corresponded to sustained elevations in mobile betting sessions lasting multiple days. Researchers tracking these periods attribute the changes to extended periods of indoor occupancy combined with ongoing professional and college sports schedules.
Autumn weather systems also register measurable effects. October 2026 brought repeated cold fronts and early snow across the Great Lakes region, and preliminary figures from Michigan and Ohio operators show corresponding upticks in football wagering during those intervals. The National Oceanic and Atmospheric Administration maintains archives that allow direct overlay of storm tracks against transaction timestamps, revealing that precipitation days above a certain threshold reliably precede volume increases within 24 to 48 hours.
Seasonal Sports Schedules and Climate Overlap
Football seasons overlap with peak winter weather risks across the Midwest, creating repeated opportunities for pattern analysis. College and professional games scheduled on weekends frequently coincide with lake-effect snow or ice events that keep residents indoors. Betting platforms record higher per capita wagers from zip codes experiencing active weather advisories, while adjacent areas under clear conditions show comparatively stable activity. One study released by the University of Illinois examined three consecutive seasons and identified statistically significant links between National Weather Service alerts and same-day betting surges in affected counties.
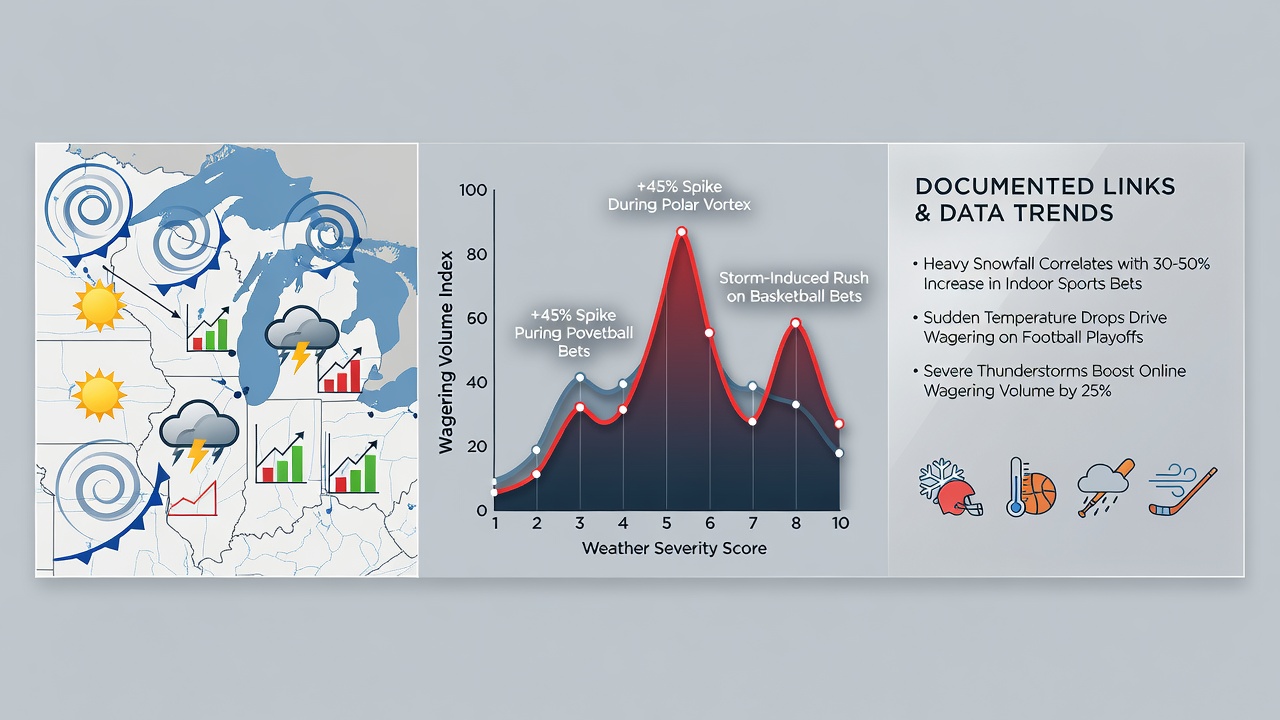
Summer thunderstorms produce shorter but detectable responses. When severe weather warnings interrupt outdoor events or evening plans, operators report brief increases in baseball and basketball wagers, particularly during evening hours. These micro-spikes differ from winter patterns because they dissipate once alerts expire, yet they appear consistently across Indiana and Missouri market data. The contrast between short-duration summer events and multi-day winter disruptions highlights how duration and severity both influence total handle.
Regional Regulatory Data Sources
State agencies publish monthly reports that enable cross-referencing with weather archives. The Indiana Gaming Commission releases sports wagering metrics broken down by county, allowing researchers to align precipitation records from the National Weather Service with localized volume changes. Comparable datasets from the Ohio Casino Control Commission and the Missouri Gaming Commission cover additional markets and support multi-state comparisons. Academic teams have begun incorporating these public records into longitudinal studies that control for variables such as promotional offers and major game outcomes.
October 2026 data continues to feed these analyses. Early snow events in the upper Midwest coincided with documented volume increases that mirrored patterns observed in prior years, reinforcing the repeatability of the observed relationship. Operators adjust staffing and server capacity in anticipation of forecast weather, demonstrating that the connection has moved from observational research into operational planning.
Conclusion
Regional weather records and sports wagering filings together establish recurring correlations between Midwestern climate events and betting volume fluctuations. Winter storms produce the largest and longest-lasting increases, while summer systems generate shorter responses. State regulatory data, combined with National Weather Service archives, supplies the foundation for ongoing examination of these links across multiple seasons and jurisdictions.